"Sett at du har lyst til å ta et bad, som mange har på denne årstiden. (Jeg kan faktisk anbefale det selv, jeg badet i havet både i går og i dag og fant det meget forfriskende.) Da lurer du kanskje på hva badetemperaturen er, og det er det heldigvis meget enkelt å finne ut av. La meg forklare.
Vi er så heldige å bo i Norge, der vi har et ypperlig Metrologisk institutt som gjør en rekke nyttige ting, som for eksempel å kjøre havmodeller som blant annet forutsier temperatur, og som i tillegg er ganske gode til å legge ut data fritt tilgjengelig på internett. Derfor kan man, om man vil, laste ned havdata for hele norskekysten (strøm, potensialtemperatur, saltholdighet og tidevann) fra thredds.met.no, som digre NetCDF-filer med data for hver time i 800 meter vertikal oppløsning. Slett ikke verst, må jeg si. Potensialtemperatur er førvrig, om jeg ikke husker feil, temperaturen vann på en gitt dybde ville fått, om den ble transportert adiabatisk til overflaten. Jammen flaks at jeg tok det oseanografikurset, ellers hadde jeg ikke greid å sjekke badetemperaturen.
Det som er enda kulere er imidlertid at Meteorologisk institutt, eller met.no som de ofte kalles (av en eller annen grunn er det ganske vanlig å referere til ulike lands offentlige metrologiske institusjoner med adressen til hjemmesiden deres), legger ut disse filene ved hjelp av en THREDDS-server (derav thredds.met.no/), som gjør at man kan gjøre kule ting som å åpne datasettene som om de var en lokal fil, kikke litt på variable og dimensjoner og slikt, og så laste ned akkurat det man trenger, og ikke hele filen.
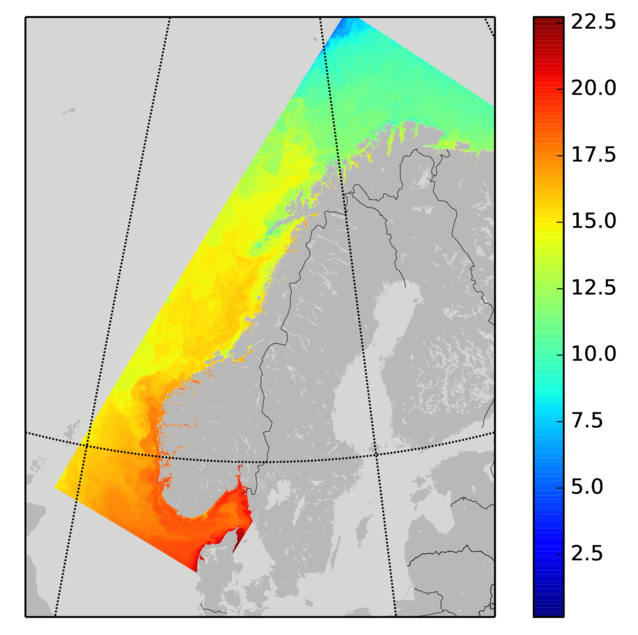
En annen kul ting man kan gjøre er å plotte dataene på et kart, slik at man for eksempel kan lage et kart over badetemperaturen langs hele kysten. La oss se på et eksempel i python:
import netCDF4
import matplotlib
# Matplotlib plotting backend. Change to produce other
# filetypes. See documentation for alternatives.
matplotlib.use('pdf')
# Basemap is a library that lets us to draw on a map.
from mpl_toolkits.basemap import Basemap
import numpy as np
import matplotlib.pyplot as plt
# Setting up the map
# We use stereographic projection centered on 65 degrees
# north, 12 degrees east. (Approximately the location of
# Bindal kommune, on the Helgeland coast). Width and
# height is set to cover a bit more than just Norway
print 'Creating map'
m = Basemap(width=1800000,height=2300000,
resolution='h',projection='stere',\
lat_ts=65,lat_0=65,lon_0=12)
# Draw continents, from the database that comes with
# matplotlib as well as country borders and a border
# around the map
m.fillcontinents(color='#aaaaaa',lake_color='#cccccc')
m.drawcountries(linewidth=0.2)
m.drawmapboundary(fill_color='#cccccc')
# draw parallels and meridians for every 20 degrees.
# Most of these won't show up in the map selection used
# here, but that doesn't matter.
m.drawparallels(np.arange(-80.,81.,20.))
m.drawmeridians(np.arange(-180.,181.,20.))
# met.no provides us with free data (or rather, free as
# in 200 free texts, since we pay for the service with
# our taxes), downloadable through the magic of thredds.
# You can open this url as if it was a local file, and
# the data are only downloaded when needed, and only as
# much as needed. Note that this link will remain valid
# only for a limited time. See the website for
# available files at any given time.
dataurl = 'http://thredds.met.no/thredds/dodsC/fou-hi/norkyst800m-1h/NorKyst-800m_ZDEPTHS_his.an.2014080700.nc'
data = netCDF4.Dataset(dataurl)
print 'Dowloading data'
# The full dataset is pretty large, so we will download
# only every third datapoint in either direction.
dx, dy = 3, 3
# The dimensions of the dataset is time, depth, lon, lat.
# We only download the first timestep, only the top layer
# and only every third datapoint in the horisontal
# directions.
temp = data.variables['temperature'][0,0,::dx,::dy]
# gridlons and gridlats tell us the lon and lat of each
# point in the temperature grid. This (or other,
# equivalent information) is necessary for drawing on
# the map. These are two dimensional grids and we only
# download every third element in either direction to
# match the temperature data.
gridlons = data.variables['lon'][::dx,::dy]
gridlats = data.variables['lat'][::dx,::dy]
# Here we use information from the map projection to
# convert from lon and lat to coordinates that can be
# used to draw data onto the map.
X, Y = m(gridlons, gridlats)
print 'Plotting'
# pcolormesh is a function which plots an array of data
# as a grid of cells with color according to the value.
plt.pcolormesh(X, Y, temp)
# Add a colorbar, so we can read the temperature.
plt.colorbar()
print 'Saving'
# Save the plot to a file.
# This can take a while, and produces a 12 MB pdf. To
# create a smaller file, such as a .png, change the
# filename as well as the backend.
plt.savefig('map.pdf')